5 Core Steps to Master Data Analytic in Shimla: A powerful beginner’s guide to start building skills

5 Core Steps to Master Data Analytic in Shimla: A powerful beginner’s guide to start building skills

Introduction: Understanding Data Analytics
Data has become incredibly paramount for modern businesses. Every Google search, online purchase, or media interaction creates a distinct digital footprint. Accumulating vast amounts of raw information, however, holds little inherent value on its own. To transform this data into informed business decisions, companies must unlock the power of information using specialized methods. Understanding the structured process of data analytic in Shimla is the first step toward turning that raw footprint into actionable insights.
Data analytics involves the systematic collection, cleaning, organization, analysis, and interpretation of data to extract meaningful patterns. Instead of simply guessing what to do, businesses use these insights to understand customer behaviour, optimize operations, save money, and predict future trends. This data-driven approach allows firms to make informed decisions and gain a significant competitive advantage.
If you are wondering how all this works, this guide will walk you through the process, the tools professionals use, and how you can start building essential skills to enter this field. For students and beginners aspiring to explore growing opportunities in data analytic in Shimla, understanding these fundamentals is crucial. Local institutes like IICE Shimla can also provide structured learning opportunities to support your journey.
Analyzing The Four Pillars of Data Analytic Techniques
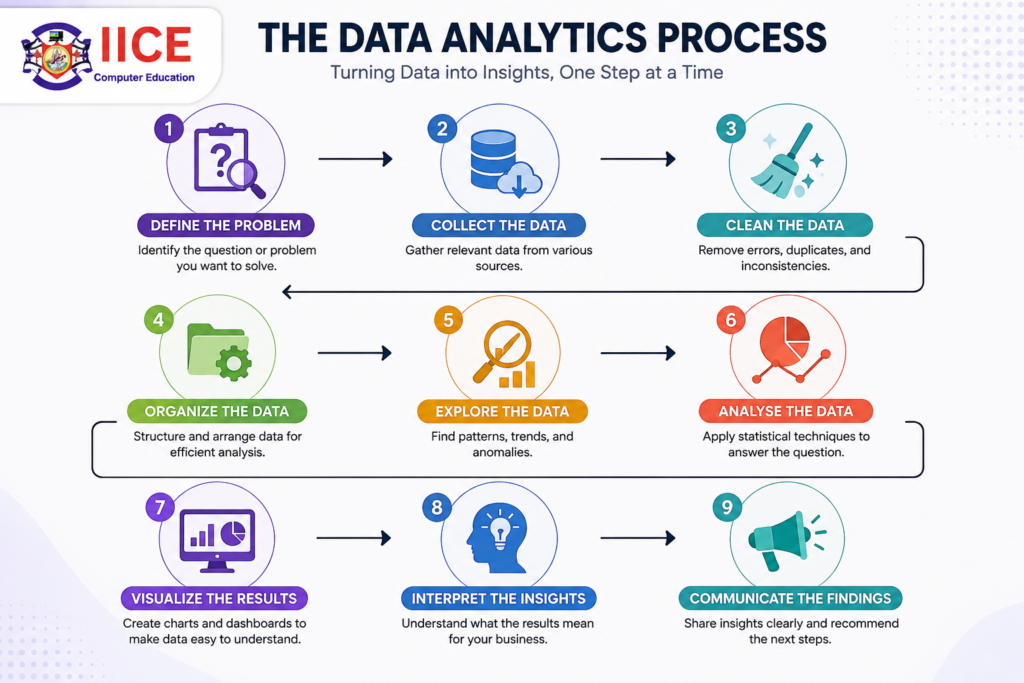
The journey of turning raw numbers into actionable business insights usually follows a specific set of steps. While the specific tools might vary, these basic stages remain consistent for data analytic professionals.
1. Define the Problem for Data Analytic Success
A good analytics project starts with a business question, not a spreadsheet. Before you even look at any data, you need to figure out what problem you are trying to solve. Asking a clear question like “Why did our mobile checkout conversions go down by 15% this quarter?” helps you determine what data you need to collect and how to analyse it.
2. Collect the Data
Once you have identified the primary goal of your data analytic project, the next step is to gather the relevant information. Professionals pull from various sources depending on the problem, including:
- CRM platforms like Salesforce
- Web analytics tools like Google Analytics
- Internal business software
- Social media metrics
- Customer surveys
3. Clean the Data for Accurate Analysis
Data is often messy in its raw form. It might have duplicates, missing values, spelling mistakes, or formatting issues. Cleaning the data is often the most time-consuming step. If you use inaccurate information, your results will be wrong. Data professionals spend significant time making sure datasets are consistent and relevant before analysis begins.
4. Organize and Structure the Data
Clean data needs to be organized properly to be analysed efficiently. This step often involves calculating new metrics from existing data, combining different datasets, or grouping data into categories for comparison.
5. Explore the Data for Initial Patterns
This is the phase where professionals start looking for obvious trends or anomalies. By examining the information through preliminary data analytic views, an analyst might notice spikes in specific location traffic or distinct buying habits among age groups, which can define the course of deeper analysis.
6. Analyse the Data
This is the core of the entire process, where statistical techniques are applied to answer the project’s defining question. Data professionals use different analytical models to compare results, identify strong correlations, discover trends, and understand business performance deeply.
7. Visualize the Data Analytic Findings
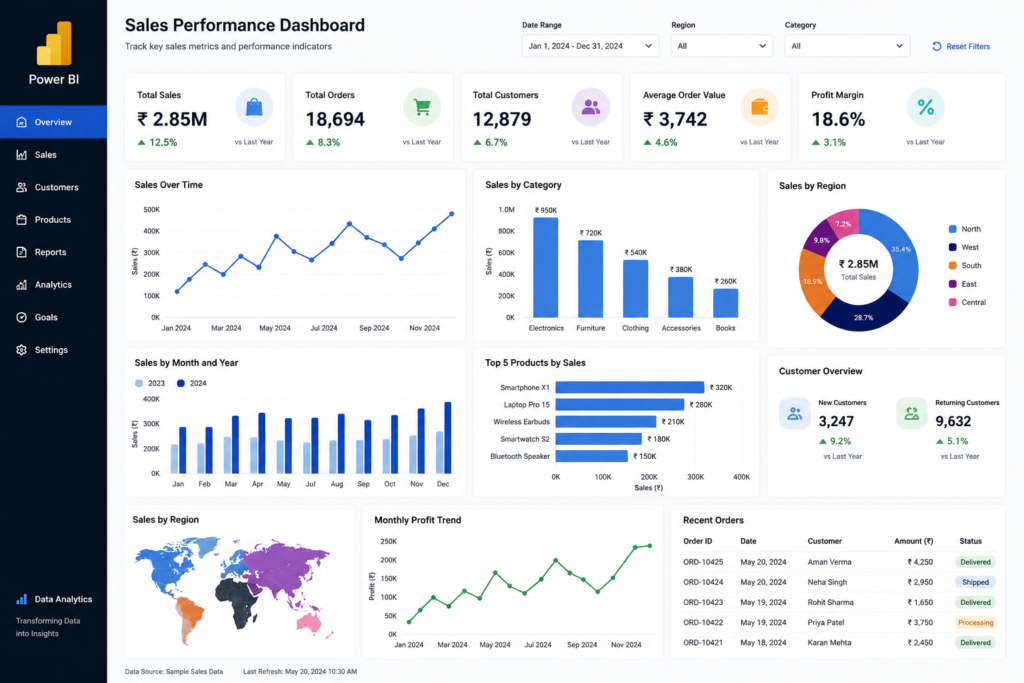
Just looking at rows of numbers in a database is difficult for decision-makers. Data visualization turns findings into easy-to-understand charts, graphs, and interactive dashboards. A well-designed visual ensures that important changes are noticed quickly.
8. Interpret the Insights
Finding a mathematical pattern is not enough; you need to understand what it means in a business context. If website traffic went up but revenue remained flat, an analyst needs to investigate why. The analyst’s job is to explain the story behind the numbers to the company.
9. Communicate the Data Analytic Findings
The final step is presenting these clear, interpreted insights to the stakeholders who make business decisions. Whether via a live dashboard, a presentation, or a written report, the communication must clearly show what happened, why it happened, and what the business should do next to gain an advantage.
A Powerful Beginner’s Guide to Data Analytic in Shimla
If you are a student or professional in the area looking to build these essential skills, follow this structured roadmap to start your career:
Master Microsoft Excel for Data Analytic Basics
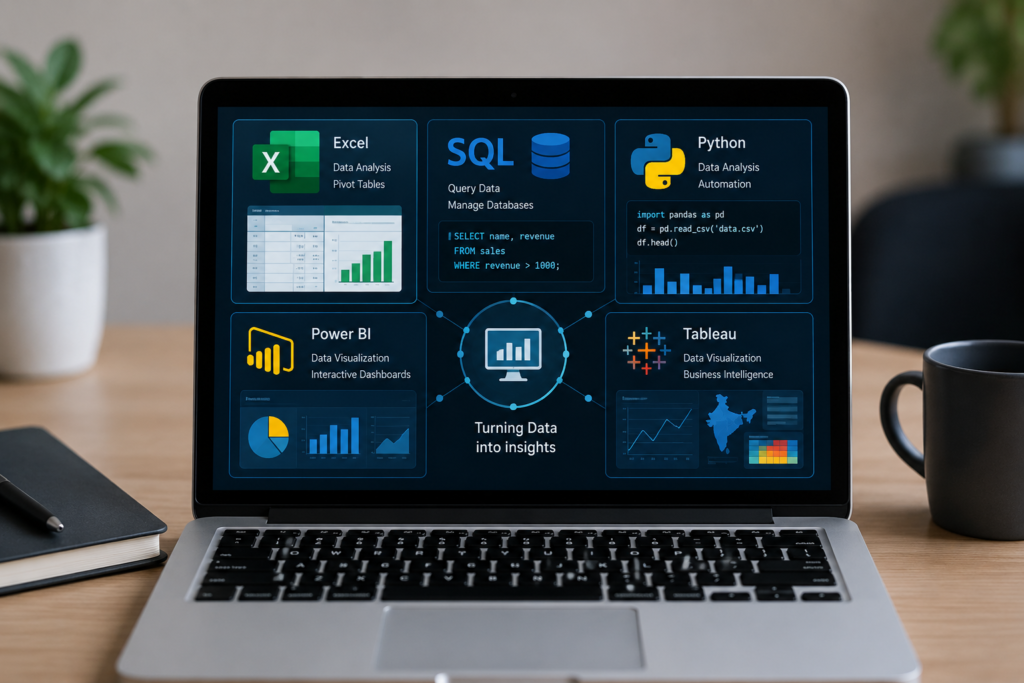
Start with the essential tools: Master Microsoft Excel deeply. While it seems simple, the core data analytic features in Excel, like formulas, charts, and pivot tables, are a powerful starting point for any beginner in this field.
Understand Statistical Fundamentals
Learn the basic concepts of statistics, including averages, data distributions, variance, and standard deviation, which form the mathematical foundation for most analytical models.
Learn to Query Data with SQL
SQL (Structured Query Language) is vital. Most analysis is done on data stored in large databases, and SQL is the universal language used by professionals to query, manipulate, and retrieve that data efficiently.
Visualize Data Analytic Trends with Business Intelligence (BI) Tools
Choose one major data analytic tool for visualization, such as Microsoft Power BI or Tableau, and learn how to connect datasets and build interactive dashboards that clearly communicate business results.
Level Up Your Data Analytic Skills with Python or R
Once you have mastered the foundational tools, learn Python or R for advanced scripting. These are standard languages used for advanced analysis, automating data cleaning tasks, and statistical modelling.
For students living in Shimla, choosing a training program that effectively combines these technical skills with practical, real-world projects can build a strong foundation. IICE Shimla is a good option for learners who want to explore hands-on training to prepare for technology and analytics opportunities in the current job market.
Starting Your Career in Data Analytic in Shimla

Data analytics is a rapidly growing field with opportunities in finance, healthcare, e-commerce, and technology. If you are just starting, follow these steps to build your skill set:
- Start with the Basics: Master Microsoft Excel. Learn how to use formulas and charts.
- Understand Statistics: Learn about averages, distributions, and probability.
- Learn to Query: Study SQL to understand how companies store and retrieve data.
- Visualize Data: Choose one tool like Power BI or Tableau and learn how to build dashboards.
- Level Up Your Skills: Once you have the basics down, learn Python to automate tasks and perform modelling.
- Build a Portfolio: Analyse real datasets and publish your findings online.
For students living in Shimla, choosing a course or training program that combines these skills with practical projects can help build a stronger foundation. IICE Shimla provides an option for learners who want to explore training and develop practical knowledge for the technology and analytics field.
Frequently Asked Questions
What is data analytics and how does it work?
Data analytics is the comprehensive process of systematic data collection, cleaning, and analysis to uncover hidden patterns and gain insights. It helps businesses identify crucial customer trends and make informed decisions, turning raw data into meaningful business strategies.
Is data analytic hard for beginners?
Data analytic is not inherently hard if you approach it step-by-step and practice regularly. Beginners in Shimla can start with user-friendly tools like Excel and gradually master SQL and Power BI. With persistent practice and analytical thinking, strong skills can be developed.
Can a 12th pass become a data analytic professional in Shimla?
Yes, a 12th pass student can certainly start learning data analytic fundamentals and build the necessary technical skills for entry-level roles. By starting with Excel, basic statistics, and SQL, and completing practical projects, you can work toward career opportunities. Students seeking guided, classroom-based data analytic in Shimla can also explore courses at local institutes like IICE.
What are the top 3 skills for a data analyst?
The top 3 skills for a data analyst are data analysis, SQL, and data visualization. Strong knowledge of Excel, statistics, and tools like Power BI or Tableau is also highly valuable. Good problem-solving and communication skills help professionals turn raw information into business decisions.
Is coding required for data analysis?
Coding is not always required to start learning data analysis as a beginner. You can begin with Excel, SQL, and Power BI before learning programming. For more advanced analysis and automation, learning Python or R can be highly beneficial.
Conclusion
Understanding the structured process of data analytic is a critical step towards modern business success. From initially defining a crucial business problem and collecting data to the final communication of actionable results, every stage of this data-driven methodology plays a vital role.
For beginners wondering how to successfully start a career in data analytic in Shimla, master the right technical tools and gaining hands-on, practical experience is vital. Local educational resources like IICE Shimla provide viable opportunities for training and practical exposure to help you enter this dynamic field confidently.