
Data analysis course in shimla

In today’s world, data has become an important part of almost everything we do. We use mobile phones, search for information online, shop on websites, use social media, watch videos, and make digital payments. All these activities create data. However, simply having a lot of data is not enough. We need to understand that data and find useful information from it. This is where data analysis comes into use.
Data analysis is the process of examining data, organising it, finding patterns, and using the results to make better decisions. It helps us understand what has happened, why it happened, and sometimes what may happen in the future. Data analysis is used by businesses, schools, hospitals, banks, governments, researchers, and many other organisations.
What Is Data Analysis?
Data analysis means studying collected information to find useful facts and answers. Data can be numbers, words, dates, customer information, sales records, survey answers, or many other types of information.
For example, suppose a clothing shop has thousands of sales records. Looking at all those records one by one would take a lot of time. Through data analysis, the shop owner can quickly find out which clothes are selling the most, which products are not popular, which month has the highest sales, and what type of customers are buying certain products.
Therefore, data analysis changes raw data into meaningful information that can be used for decision-making.
Why Is Data Analysis Important?
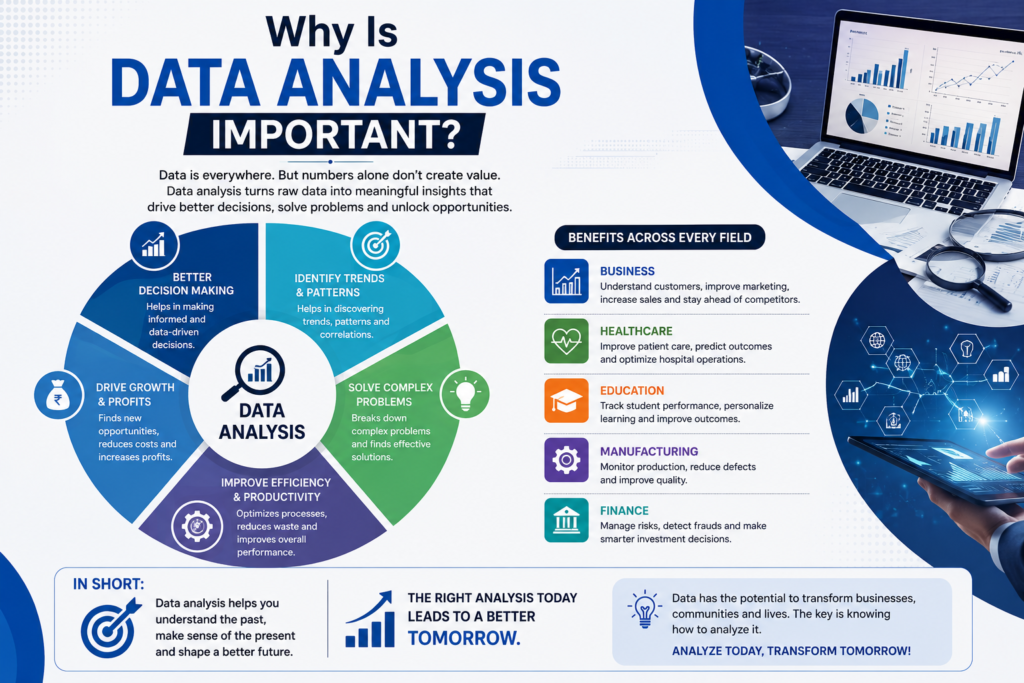
Data analysis is important because it helps people make decisions based on facts rather than guesses. In the past, businesses often depended heavily on experience and personal opinions. Today, they can use data to understand their customers and markets more clearly.
For example, if a company wants to open a new store, it can study information about customers, population, competition, prices, and previous sales. This information can help the company choose a better location.
Data analysis can also help organisations save money. By studying their expenses, they can find areas where they are spending too much. Similarly, businesses can identify products that are not selling well and decide whether to improve them or stop selling them.
Main Steps of Data Analysis
Data analysis is usually completed through several steps.
1. Collecting Data
The first step is collecting data. Data can be collected from many different sources. These include surveys, websites, mobile applications, customer records, social media, sensors, interviews, and company databases.
The quality of the collected data is very important. If the original data is incorrect, the final results may also be incorrect.
2. Cleaning Data
Raw data often contains errors. There may be missing information, duplicate records, spelling mistakes, or incorrect numbers. Data cleaning involves finding and correcting these problems.
For example, if a customer’s age is entered as 250 instead of 25, the analyst needs to identify and correct the mistake.
3. Organizing Data
After cleaning, the data needs to be organised. It can be placed into rows and columns using spreadsheets or databases. Proper organisation makes the information easier to study.
4. Analyzing Data
This is the main stage of the process. Analysts use different methods to understand the data. They may calculate averages, percentages, totals, and growth rates. They may also compare different groups and look for patterns.
For example, a company can compare sales from January and January of the previous year to see whether its business has grown.
5. Presenting the Results
After analyzing the data, the results need to be explained. Tables, charts, graphs, and dashboards are commonly used for this purpose.
A simple graph can sometimes explain information much more clearly than a large table full of numbers.
6. Making Decisions
The final purpose of data analysis is usually to support a decision or solve a problem. After understanding the results, a business or organisation can decide what action to take.
Different Types of Data Analysis
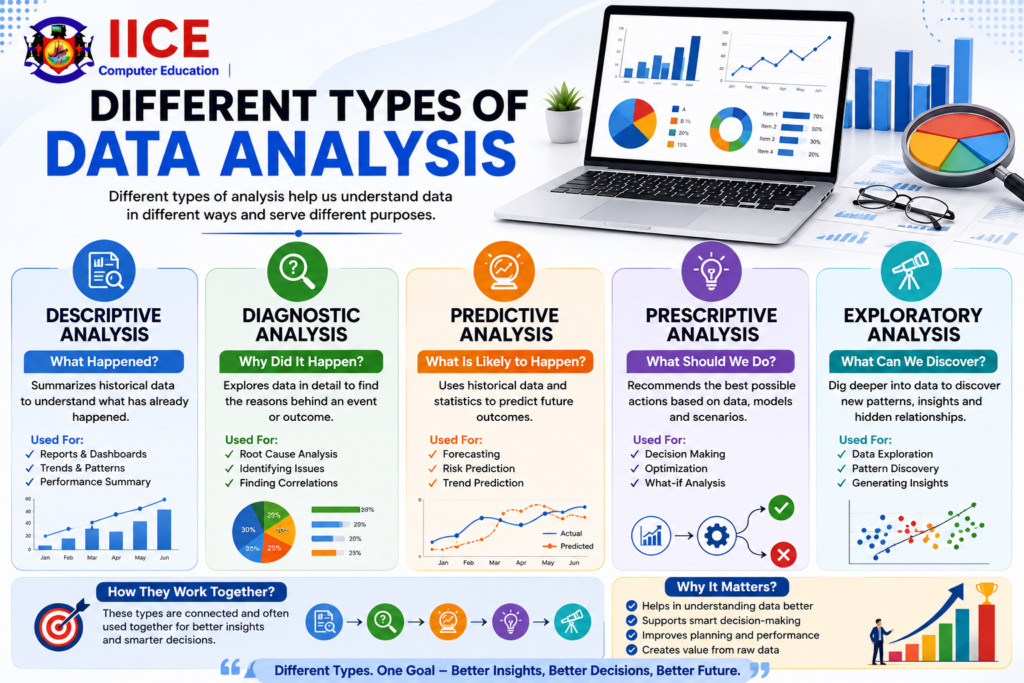
There are four common types of data analysis.
Descriptive analysis explains what happened in the past. For example, a company may analyze last year’s sales to understand its performance.
Diagnostic analysis focuses on finding out why something happened. If sales decreased, the company may study customer complaints, prices, competitors, and other information to find the reason.
Predictive analysis uses existing information to estimate what could happen in the future. For example, a company may predict next month’s sales based on previous sales trends.
Prescriptive analysis helps suggest what action should be taken. For example, based on customer demand, it may suggest increasing the stock of a particular product.
Data Analysis Tools
There are many tools that can be used for data analysis. The choice of tool depends on the type and size of the data.
Microsoft Excel is one of the most popular tools for beginners. It can be used to organize data, perform calculations, create charts, and make simple reports.
SQL is commonly used to work with databases. It allows analysts to find and manage specific information from large collections of data.
Python is another popular choice. It is useful for data cleaning, calculations, visualization, and advanced analysis. Python also has libraries such as Pandas and NumPy that make data-related work easier.
Power BI and Tableau are widely used for creating interactive reports and dashboards. They help organizations understand large amounts of information through visual displays.
Data Visualization
Data visualisation is an important part of data analysis. It means presenting data using graphs, charts, maps, and other visual formats.
For example, a line graph can show how sales changed over several months. A bar chart can compare the sales of different products. A pie chart can show how a company’s total sales are divided among different categories.
Good visualisation makes complicated information easier to understand. It also helps people notice patterns and changes quickly.
Uses of Data Analysis
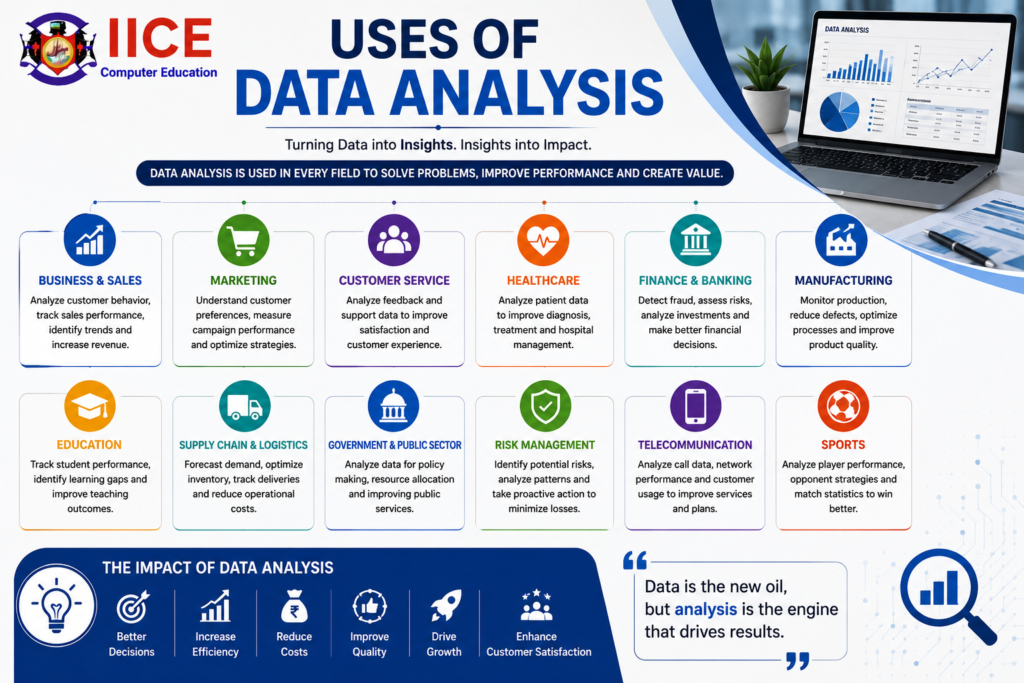
Data analysis is used in many different areas.
In business, it helps companies understand customers, improve products, study sales, and increase profits.
In healthcare, data can help doctors and organisations study patient information, understand diseases, and improve healthcare services.
In education, schools and colleges can analyse student marks, attendance, and learning progress. This can help teachers identify students who may need additional support.
In banking, data analysis can be used to understand customer behaviour, study transactions, and identify unusual activities.
In marketing, companies analyse customer preferences and online behaviour to understand which advertisements and products are more effective.
In sports, teams can analyse player performance, match results, fitness information, and other statistics to improve their strategies.
Example of Data Analysis
Imagine a restaurant wants to understand why its sales have decreased.
First, it collects information about daily sales, popular dishes, customer reviews, prices, and the number of customers.
Next, the restaurant cleans and organises the information. The owner then compares sales from different days and months.
The analysis may show that sales are lower on weekdays and that some expensive dishes are rarely ordered. Customer reviews may also show that people want more affordable meal options.
Based on these findings, the restaurant could introduce weekday discounts or add cheaper meal choices.
This simple example shows how data analysis can help solve a real-world problem.
Benefits of Data Analysis
Data analysis provides many benefits. It helps organizations make better decisions, understand customers, identify problems, reduce costs, improve performance, and find new opportunities.
It can also save time. Instead of manually checking thousands or millions of records, software can process large amounts of data quickly.
Another benefit is that data analysis can help identify trends. For example, a business may discover that demand for a particular product increases during certain months. The company can then prepare enough stock before demand rises.
Challenges in Data Analysis
Although data analysis is useful, it also has some challenges. One common problem is poor-quality data. Incorrect or incomplete data can produce misleading results.
Another challenge is handling large amounts of information. As the amount of data increases, organizations need better tools and systems to manage it.
Privacy is also important. Personal information must be handled carefully and responsibly. Organizations should make sure that sensitive customer information is protected.
Analysts also need to avoid making incorrect conclusions. A pattern in data does not always mean that one thing caused another. Results should be studied carefully before making important decisions.
Skills Required for a Data Analyst
A data analyst needs several useful skills. Basic mathematics and statistics are important because analysts often work with numbers.
Knowledge of tools such as Excel, SQL, Python, Power BI, or Tableau can also be helpful. However, technical skills are not enough.
A good analyst should have problem-solving skills, logical thinking, and attention to detail. Communication skills are also important because analysts need to explain their findings to people who may not have technical knowledge.
Curiosity is another valuable quality. A good analyst does not simply look at numbers. They ask questions such as: Why did this happen? What changed? What can we learn from this information? What should we do next?
Future of Data Analysis
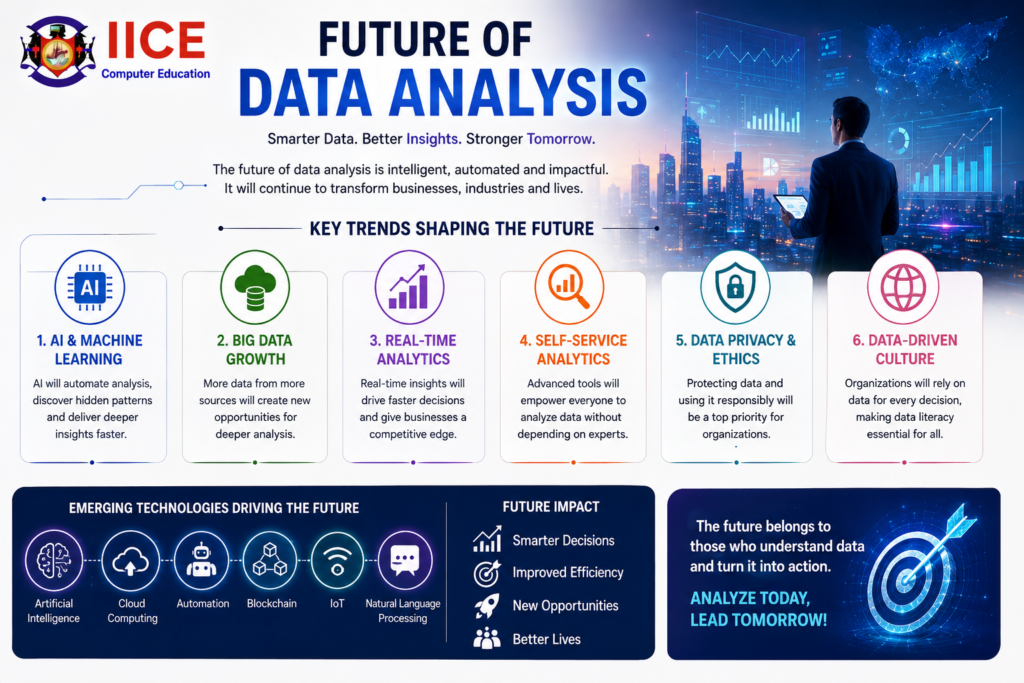
The future of data analysis is growing because the amount of digital information is increasing every day. Companies and organizations need people who can understand this information and use it effectively.
Artificial intelligence and machine learning are also becoming important in data analysis. These technologies can help identify patterns and make predictions from large amounts of data.
However, human involvement will continue to be important. Technology can process information, but people still need to understand the situation, check the results, and make responsible decisions.
Frequently Asked Questions About Data Analysis
1. What is data analysis?
Data analysis is the process of collecting, cleaning, organizing, and studying data to find useful information. It helps people understand problems and make better decisions.
2. Why is data analysis important?
Data analysis is important because it helps people make decisions using facts and information instead of only guesses or opinions. It can also help businesses find problems, understand customers, and improve their performance.
3. What does a data analyst do?
A data analyst collects and cleans data, studies it, finds patterns, creates charts and reports, and explains the results. Their main job is to turn data into useful information.
4. Is data analysis difficult to learn?
Data analysis can seem difficult at first, especially when learning statistics or programming. However, beginners can start with simple tools such as Excel and gradually learn SQL, Python, Power BI, or other tools.
5. Which tools are used for data analysis?
Common data analysis tools include Microsoft Excel, SQL, Python, R, Power BI, and Tableau. Excel is often a good starting point for beginners.
6. Do I need programming knowledge for data analysis?
Programming is not always required for basic data analysis. You can perform many tasks using Excel and other visual tools. However, learning SQL and Python can be very useful for handling larger and more complicated datasets.
7. What is the difference between data analysis and data analytics?
The terms are often used in similar ways. Data analysis mainly focuses on examining data and finding useful information. Data analytics is a broader term that can include analyzing data, finding trends, making predictions, and supporting business decisions.
8. Where is data analysis used?
Data analysis is used in many fields, including business, healthcare, education, banking, marketing, sports, finance, technology, and government.
9. What are the main types of data analysis?
The four common types are descriptive, diagnostic, predictive, and prescriptive analysis. They help answer different questions about what happened, why it happened, what may happen, and what action should be taken.
10. What is data visualisation?
Data visualisation means showing information through charts, graphs, maps, and other visual methods. It makes large or complicated amounts of data easier to understand.