
Tableau Course
August 10, 2026 2026-08-12 9:36Tableau Course
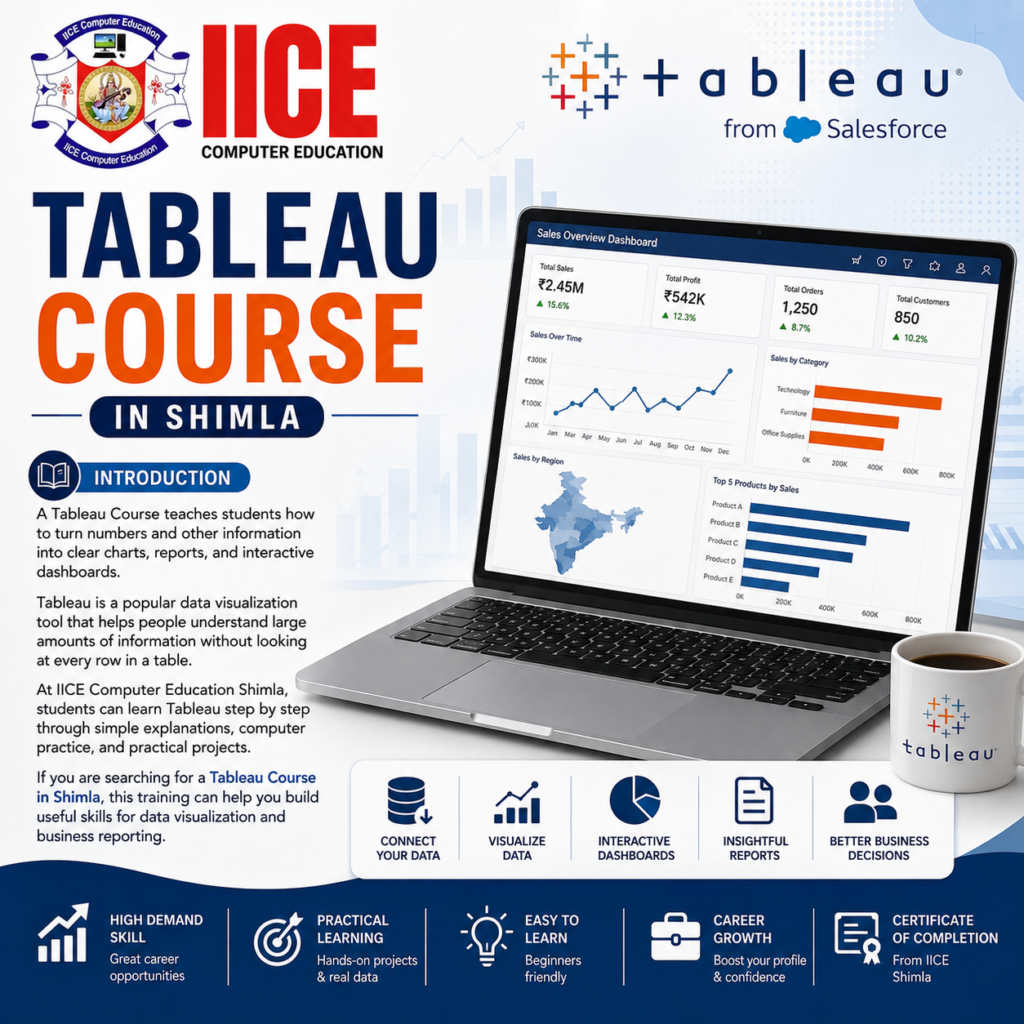
Tableau Course in Shimla
Introduction
A Tableau Course teaches students how to turn numbers and other information into clear charts, reports, and interactive dashboards. Tableau is a popular data visualization tool that helps people understand large amounts of information without looking at every row in a table. For example, a shop may have thousands of sales records, but a Tableau dashboard can show the best-selling products, monthly sales, customer trends, and business performance in an easy-to-understand way. At IICE Computer Education Shimla, students can learn Tableau step by step through simple explanations, computer practice, and practical projects. If you are searching for a Tableau Course in Shimla, this training can help you build useful skills for data visualization and business reporting.
What Is Tableau?
Tableau is a tool used to connect, study, and present data through visual reports. It can take information from sources such as Excel files, databases, and other supported sources and turn that information into charts and dashboards.
Imagine that you have a large notebook filled with sales information. Finding important information by reading every line can take a long time. Tableau helps you see the important information through charts, graphs, maps, tables, and dashboards.
A Tableau Course helps students understand how to bring data into Tableau, prepare it, create visualizations, and build interactive dashboards that other people can easily understand.
Why Learn Tableau?
Data is becoming an important part of almost every business. Companies collect information about customers, products, sales, employees, marketing, expenses, and many other activities. They need people who can turn this information into clear reports.
Learning Tableau can help students understand how to present data in a simple visual form. Instead of showing a manager a large table containing thousands of numbers, an analyst can create a dashboard that highlights the most important information.
A Tableau Course in Shimla can therefore be useful for students, graduates, working professionals, and beginners who want to develop skills in data visualization, reporting, and business intelligence.
Tableau Course Syllabus
The syllabus is divided into 4 simple modules so students can learn Tableau step by step.
Module 1: Tableau Basics and Data Connection
The first module introduces students to Tableau and explains how the software works. Students learn about the Tableau interface, workbooks, worksheets, dashboards, and different types of data. They also learn how to connect Tableau with Excel files, CSV files, databases, and other supported data sources. The aim is to help beginners understand how data enters Tableau and how it can be prepared for visualization.
Topics Covered
- Introduction to Tableau
- Tableau Desktop
- Tableau Interface
- Workbooks and Worksheets
- Understanding Data Sources
- Connecting Excel Files
- Connecting CSV Files
- Connecting Databases
- Data Types
- Dimensions and Measures
- Rows and Columns
- Basic Data Preparation
- Creating the First Tableau Report
Module 2: Data Preparation and Tableau Calculations
The second module teaches students how to prepare information before creating charts and dashboards. Real-world data may contain missing values, duplicate records, incorrect formats, or unnecessary information. Students learn how to work with these problems and prepare cleaner data.
Students also learn calculated fields and basic Tableau calculations. These features help create new information from existing data and make reports more useful.
Topics Covered
- Data Cleaning
- Data Sorting and Filtering
- Data Groups
- Data Sets
- Data Hierarchies
- Calculated Fields
- Basic Calculations
- Date Calculations
- String Calculations
- Number Calculations
- Parameters
- Filters
- Data Organization
- Basic Data Analysis
Module 3: Data Visualization and Interactive Reports
The third module focuses on creating charts and visual reports. Students learn that different types of information need different types of charts. For example, a line chart can show changes over time, while a bar chart can compare different products.
Students learn how to create visualizations that are simple, clear, and easy to understand. They can also add filters and other interactive features to help users explore the data.
Topics Covered
- Introduction to Data Visualization
- Bar Charts
- Line Charts
- Pie Charts
- Area Charts
- Scatter Plots
- Maps
- Heat Maps
- Tree Maps
- Tables
- Highlight Tables
- Filters
- Interactive Charts
- Tooltips
- Data Labels
- Data Storytelling
Module 4: Dashboards, Advanced Tableau and Projects
The final module brings all the skills together. Students learn how to create professional-looking dashboards that combine different charts and information in one place.
They also learn advanced dashboard features and complete practical projects. Projects can include sales dashboards, customer analysis, business reports, marketing dashboards, and performance reports.
Topics Covered
- Dashboard Creation
- Dashboard Layout
- Interactive Dashboards
- Dashboard Filters
- Dashboard Actions
- Drill-Down
- Parameters
- Advanced Calculations
- Dashboard Design
- KPI Dashboards
- Data Storytelling
- Tableau Reports
- Publishing Concepts
- Sales Dashboard Project
- Customer Analysis Project
- Business Performance Project
- Final Tableau Project
Why Choose IICE Computer Education Shimla?
Choosing a training institute is an important decision. Students should look for a clear syllabus, practical classes, trainer support, projects, and enough time to practise.
IICE Computer Education Shimla provides computer and technology education for students and learners. For people searching for a Tableau Course in Shimla, learning locally can provide face-to-face interaction and regular practical training.
Students should check the latest course duration, fees, batch timings, syllabus, certificate details, and practical facilities with the institute before admission.
What is a Tableau Course and what will students learn?
A Tableau course is a hands-on training program that teaches you how to turn raw numbers into clear, interactive charts and visual dashboards. You will learn how to connect different data sources (like Excel or SQL databases), clean raw records, perform custom calculations, build dynamic reports, and present data-driven insights that help businesses make smart decisions.
Who can join a Tableau Course in Shimla without experience?
Anyone can join! College students, recent graduates, job seekers, and working professionals from both technical and non-technical backgrounds (such as Commerce, Arts, or Management) can enroll. No prior tech experience or computer science degree is needed to get started.
Is Tableau easy for beginners to learn and understand?
Yes, Tableau is extremely beginner-friendly! Unlike complex programming languages, Tableau relies on an intuitive drag-and-drop interface. If you know how to work with basic spreadsheets, you can easily pick up Tableau within a few weeks of guided, hands-on practice.
What topics are covered in Tableau training in Shimla?
The training takes you step-by-step from data connection to executive dashboard design. Key topics include connecting data sources (Excel, CSV, databases), building custom charts, using calculated fields and parameters, creating interactive filters, mapping geographical data, and publishing interactive storyboards.
Do I need coding knowledge before learning Tableau?
Not at all. Tableau is designed specifically for visual analytics, so you don’t need to write complex lines of code. While learning simple logic formulas (very similar to Excel functions) is part of the course, zero programming background is required.
Can I learn Tableau after completing Advanced Excel training?
Yes, in fact, combining Advanced Excel with Tableau is one of the absolute best learning paths for data analytics. Excel helps you organize and structure raw numbers, while Tableau allows you to elevate that data into high-level, interactive visual dashboards.
What career opportunities are available after learning Tableau?
Tableau skills are in high demand across IT, finance, healthcare, e-commerce, and consulting sectors. Popular job roles you can target include Tableau Developer, Business Intelligence (BI) Analyst, Data Analyst, Reporting Specialist, and Business Operations Analyst.
Is Tableau training suitable for students and beginners in Shimla?
Yes, absolutely. Local students in Shimla can master a top-tier global Business Intelligence tool without needing to move to metro cities. It gives local graduates a massive competitive advantage when applying for remote, hybrid, or corporate analytics jobs.
What practical projects can students create after learning Tableau?
You will build portfolio-ready, real-world projects such as E-commerce Sales Dashboards, Customer Analytics Reports, HR Performance Trackers, and Financial KPI Dashboards using actual industry datasets.
Is Tableau useful for building a career in data analytics?
Yes, Tableau is one of the premier Business Intelligence and data visualization tools used by companies worldwide. Modern organizations rely heavily on visual storytelling to make strategic choices, making Tableau a vital asset alongside SQL and Excel for a successful career in data analytics.