
Statistics for Data Analytics
August 10, 2026 2026-08-12 9:35Statistics for Data Analytics
Statistics for Data Analytics in Shimla
Introduction
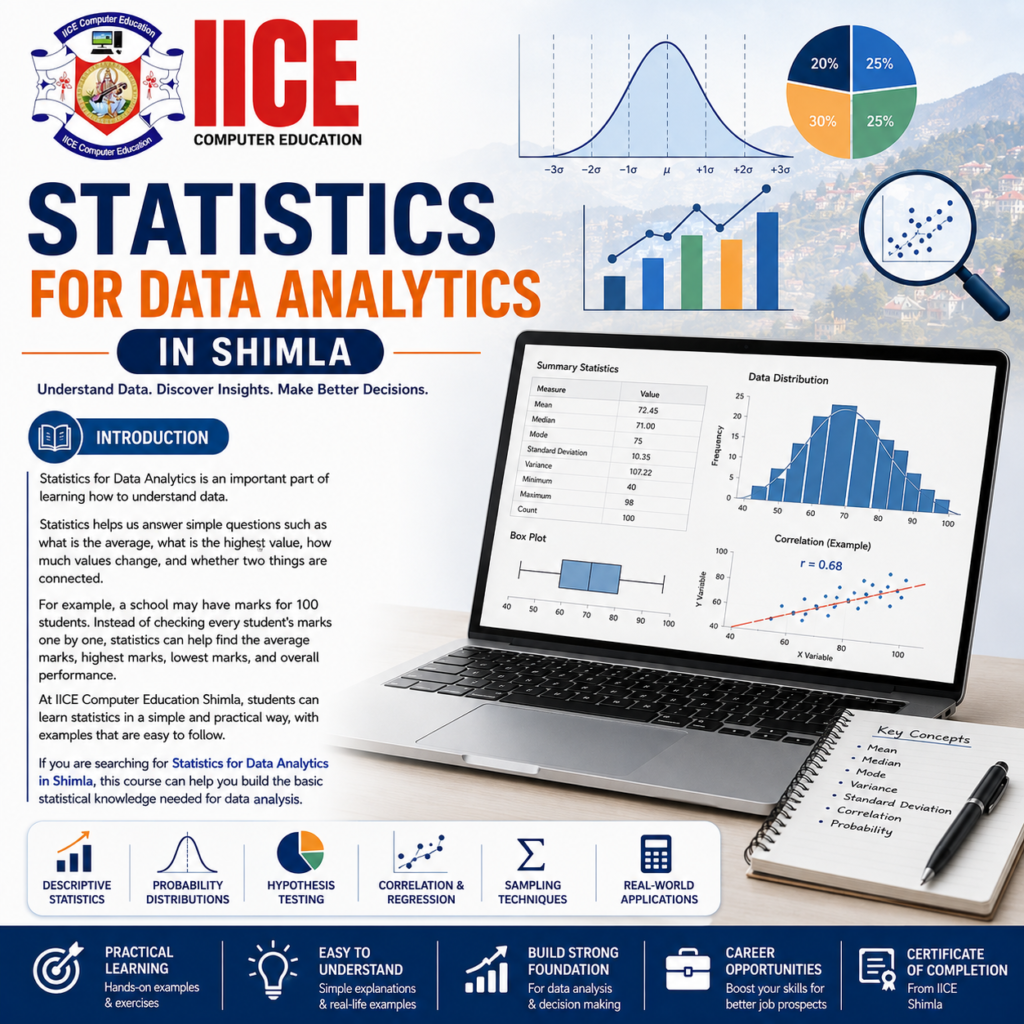
Statistics for Data Analytics is an important part of learning how to understand data. Statistics helps us answer simple questions such as what is the average, what is the highest value, how much values change, and whether two things are connected. For example, a school may have marks for 100 students.
Instead of checking every student’s marks one by one, statistics can help find the average marks, highest marks, lowest marks, and overall performance. At IICE Computer Education Shimla, students can learn statistics in a simple and practical way, with examples that are easy to follow. If you are searching for Statistics for Data Analytics in Shimla, this course can help you build the basic statistical knowledge needed for data analysis.
What Is Statistics for Data Analytics?
Statistics means collecting, organizing, studying, and understanding numbers. When statistics is used with data analytics, it helps an analyst understand what the data is trying to say.
For example, imagine that a shop has sales records for one year. An analyst can use statistics to find the average monthly sales, compare different months, understand how much sales change, and identify unusual results.
Statistics for Data Analytics does not mean learning difficult mathematics only. The main goal is to understand numbers and use them to answer real questions.
Why Is Statistics Important for Data Analytics?
Data can contain thousands or even millions of numbers. Looking at every number separately can make it difficult to understand the bigger picture. Statistics gives us simple ways to summarize and compare information.
Students can use statistics to understand averages, differences, patterns, relationships, and changes in data. These skills are useful when working with Excel, SQL, Python, Power BI, Tableau, and other data tools.
Learning Statistics for Data Analytics can therefore give students a stronger foundation before they move into advanced data analysis, business intelligence, or data science.
Statistics Course in Shimla
If you are looking for a Statistics Course in Shimla, it is useful to choose a program that explains concepts with practical examples. At IICE Computer Education Shimla, students can learn statistical ideas step by step instead of trying to understand complicated formulas all at once.
For example, students can use simple sales, student marks, customer, or business datasets to understand how averages, percentages, variation, and relationships work.
Statistics for Data Analytics Syllabus
The syllabus is divided into 4 simple modules so beginners can learn statistics step by step.
Module 1: Statistics Fundamentals and Descriptive Statistics
The first module introduces students to the basic ideas of statistics. Students learn what data is, different types of data, and how information can be organized and summarized. They learn how to calculate and understand measures such as mean, median, mode, minimum, maximum, range, and percentage.
Topics Covered
- Introduction to Statistics
- Importance of Statistics in Data Analytics
- Types of Data
- Qualitative and Quantitative Data
- Population and Sample
- Data Collection
- Data Organization
- Mean
- Median
- Mode
- Minimum and Maximum
- Range
- Percentages
- Frequency Distribution
- Basic Data Summarization
Module 2: Probability, Variation and Data Distribution
The second module helps students understand how data can change and how likely different results can be. Students learn basic probability and the ideas of variance and standard deviation.
They also learn about data distributions and why some values may be close together while others may be spread far apart. Simple examples make these topics easier for beginners to understand.
Topics Covered
- Introduction to Probability
- Basic Probability Rules
- Simple Events
- Independent Events
- Conditional Probability Basics
- Variance
- Standard Deviation
- Data Spread
- Normal Distribution
- Skewness
- Outliers
- Understanding Data Distribution
- Practical Statistical Examples
Module 3: Correlation, Regression and Statistical Analysis
The third module focuses on relationships between different pieces of data. Students learn about correlation and understand whether two variables move together.
For example, students can study whether advertising spending and sales are related. They also learn the basic idea of regression and how it can be used to understand or estimate relationships between variables.
Topics Covered
- Introduction to Correlation
- Positive Correlation
- Negative Correlation
- No Correlation
- Correlation Coefficient
- Scatter Plots
- Introduction to Regression
- Simple Linear Regression
- Variables
- Independent and Dependent Variables
- Trend Analysis
- Practical Correlation Examples
- Basic Regression Analysis
Module 4: Statistical Testing, Data Analysis and Practical Projects
The final module introduces students to basic statistical testing and practical data analysis. Students learn why samples are used, how to compare groups, and how statistical results can support decisions.
Students also practise statistics using Excel and other data tools. Practical projects help learners use different concepts together instead of learning them only as separate topics.
Topics Covered
- Introduction to Statistical Testing
- Hypothesis Testing Basics
- Null and Alternative Hypothesis
- P-Value Basics
- Confidence Intervals
- Sampling Methods
- Comparing Data Groups
- Basic A/B Testing
- Statistical Interpretation
- Using Excel for Statistics
- Statistical Data Analysis Project
- Business Data Project
- Final Statistics Project
Why Choose IICE Computer Education Shimla?
IICE Computer Education Shimla provides computer and technology education for students and learners. For students looking for Statistics for Data Analytics in Shimla, learning through a structured program can help make difficult topics easier to understand.
A good learning environment should provide clear explanations, practical examples, regular exercises, and project work. Students should also have opportunities to connect statistics with tools such as Excel and other data analytics software.
Before admission, students should confirm the current course details, fees, duration, batch schedule, and available facilities with the institute.
Faqs
What is Statistics for Data Analytics and what will students learn?
Statistics for Data Analytics is the science of collecting, analyzing, and interpreting numerical data to discover patterns, make predictions, and drive smart business decisions. Instead of just looking at raw numbers, students learn how to turn data into actionable insights. In this training, you will learn fundamental concepts like descriptive and inferential statistics, probability distributions, hypothesis testing, correlation, regression analysis, and how to apply these techniques using real-world tools like Excel, Python, or R.
Who can join Statistics training in Shimla without experience?
Anyone with a curious mind and basic computer knowledge can join! This course is ideal for college students, fresh graduates, job seekers, working professionals looking to upskill, and non-tech background learners in Shimla who want to start a career in data science, business analytics, or digital marketing. No prior coding or statistical experience is required.
Is Statistics easy for beginners to learn and understand?
Yes, absolutely! When taught with practical, real-life examples rather than pure textbook theory, statistics becomes intuitive and logical. The concepts are broken down step-by-step—starting from basic averages and charts to advanced predictive models—making it easy for beginners to grasp and apply with confidence.
What topics are covered in Statistics training in Shimla?
The curriculum covers all essential foundational and applied statistical concepts, including:
Descriptive Statistics: Mean, median, mode, variance, standard deviation, and data visualization.
Probability & Distributions: Normal distribution, binomial distribution, and probability density functions.
Inferential Statistics: Sampling techniques, central limit theorem, and confidence intervals.
Hypothesis Testing: Z-tests, t-tests, ANOVA, and Chi-Square tests.
Predictive Modeling: Linear and multiple regression, correlation analysis, and trend forecasting.
Practical Application: Applying statistical methods to real business datasets using tools like Excel or Python.
Do I need strong mathematics skills to learn Statistics?
Not at all. You only need basic school-level arithmetic (addition, subtraction, multiplication, and percentages). Modern data analytics relies on software and tools to handle heavy math calculations automatically. Your primary job as an analyst is to understand what the calculations mean and how to interpret the findings to solve real problems.
Can I learn Statistics after completing an Excel course?
Yes, in fact, taking Statistics after an Excel course is the perfect learning pathway! Excel gives you the hands-on skills to organize, clean, and manipulate data, while Statistics gives you the analytical mindset to understand what the data is actually telling you. Combining both skills makes you significantly more job-ready.
What career opportunities are available after learning Statistics?
Mastering statistics opens doors to high-demand roles across various industries, including:
Data Analyst
Business Intelligence (BI) Analyst
Junior Data Scientist
Marketing Analyst
Financial/Risk Analyst
Research Assistant
Is Statistics training suitable for students and beginners in Shimla?
Yes! Shimla’s job market and educational landscape are increasingly shifting toward tech-driven and analytical skills. Learning statistics locally gives students and fresh graduates a major competitive edge, allowing them to secure remote jobs, apply for corporate roles in IT hubs, or work with regional businesses looking to leverage data.
What practical projects can students complete during Statistics training?
Students work on real-world hands-on projects, such as:
Sales & Revenue Forecasting: Analyzing historical business data to predict future trends.
Customer Behavior Analysis: Using probability and hypothesis testing to understand purchase patterns.
A/B Testing for Marketing: Evaluating which website layout or digital ad campaign performs better.
Survey & Market Research Analysis: Cleaning, visualizing, and drawing insights from public or organizational survey data.
Is Statistics useful for building a career in data analytics?
It isn’t just useful—it is mandatory. Statistics forms the absolute backbone of data analytics, data science, and artificial intelligence. Without statistical knowledge, you can create fancy charts, but you won’t be able to validate whether your insights are accurate or trustworthy. Learning statistics is the single best foundation for a long-term, successful career in data.