
Power BI Course
August 10, 2026 2026-08-12 8:41Power BI Course
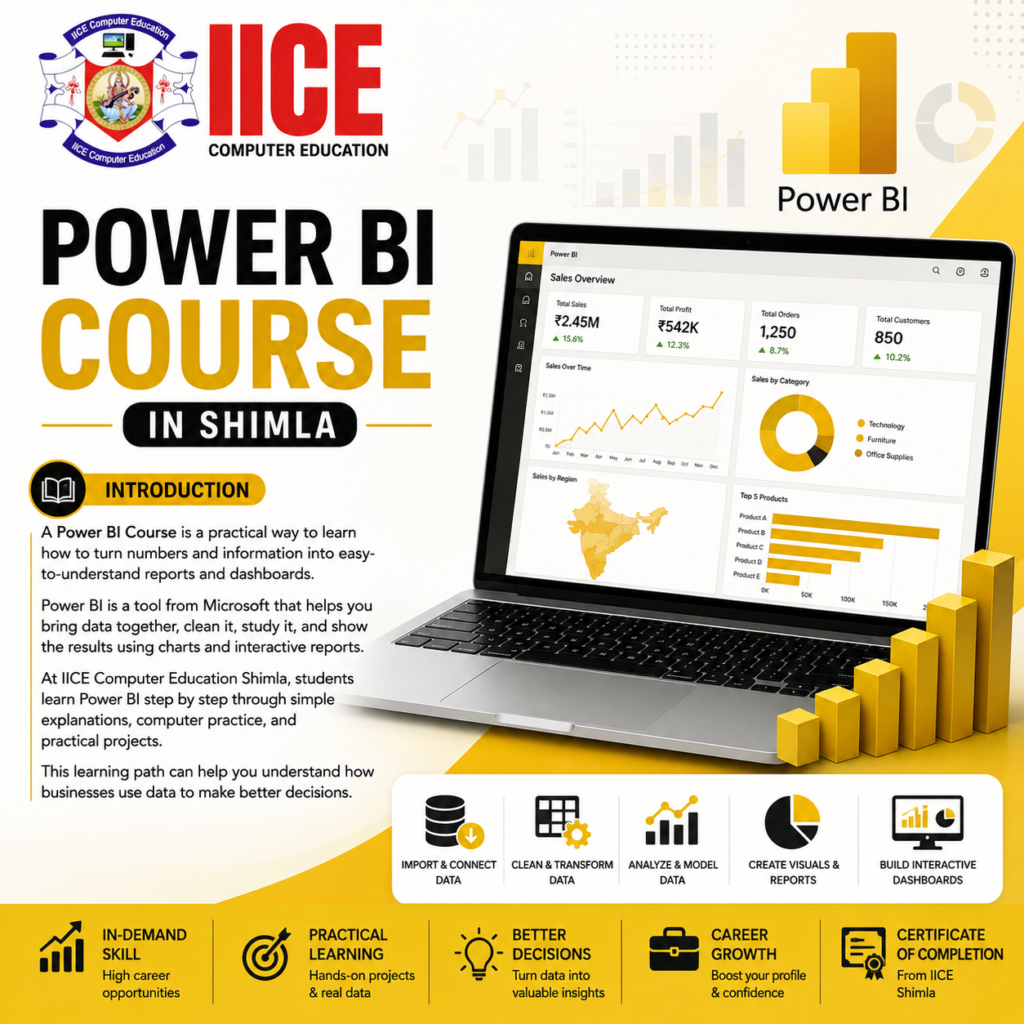
Power BI Course in Shimla
Introduction
A Power BI Course is a practical way to learn how to turn numbers and information into easy-to-understand reports and dashboards. Power BI is a tool from Microsoft that helps people bring data together, clean it, study it, and show the results using charts and interactive reports. Instead of looking at hundreds or thousands of rows in a table, you can use Power BI to see the important information in one clear dashboard. At IICE Computer Education Shimla, students can learn Power BI step by step through simple explanations, computer practice, and practical projects. If you are looking for a Power BI Course in Shimla, this learning path can help you understand how businesses use data to make better decisions.
What Is Power BI?
Power BI is a business intelligence and data visualization tool used to work with information. Think about a shop that has thousands of sales records. It can be difficult to understand all those numbers by looking at them one by one. Power BI can turn those records into charts, graphs, tables, and dashboards that make the information easier to understand.
Students learning a Power BI Course can understand how to connect data, clean it, organize it, create calculations, and build useful reports. The main idea is simple: take raw data and turn it into a clear picture that people can understand.
Why Learn Power BI?
Learning Power BI can be useful for students and professionals who want to work with reports and business information. Companies collect data about sales, customers, products, employees, expenses, and many other things. Power BI helps bring this information together and show important results in a simple way.
A Power BI Course in Shimla can help learners develop skills in data cleaning, data modelling, report creation, dashboard design, and data visualization. These skills can be useful for office work, reporting jobs, business analysis, MIS roles, and other data-related careers.
Power BI Course in Shimla at IICE
IICE Computer Education Shimla provides computer and technology training for students and learners who want to develop practical digital skills. A Power BI Course in Shimla at a local institute can give students the opportunity to learn with direct guidance and regular computer practice.
Students can learn each topic from the beginning and then practise it using sample datasets. Instead of only reading about dashboards, students can create their own reports and learn how different Power BI features work together.
Power BI Course Syllabus
The syllabus is divided into 4 simple modules so that students can learn Power BI step by step.
Module 1: Power BI Basics and Data Connection
The first module introduces students to Power BI and explains how the tool works. Students learn about the Power BI interface, reports, dashboards, datasets, and different types of data. They learn how to connect Excel files, CSV files, and other supported data sources. Students also learn how to load data into Power BI and understand the basic steps needed before creating a report.
Topics Covered
- Introduction to Power BI
- Power BI Desktop
- Power BI Interface
- Reports, Pages and Visuals
- Understanding Data Sources
- Connecting Excel Data
- Connecting CSV Data
- Importing Data
- Managing Data Tables
- Basic Data Types
- Creating a Simple Report
Module 2: Data Cleaning, Power Query and Data Modelling
The second module teaches students how to prepare data before using it in a report. Real-world data may contain empty cells, duplicate records, incorrect formats, or unnecessary information. Students learn how to clean and organize this information using Power Query.
Students also learn how different tables can be connected. This helps them understand how customer, product, sales, and other business information can work together in one report.
Topics Covered
- Introduction to Power Query
- Data Cleaning
- Removing Duplicate Data
- Handling Missing Values
- Changing Data Types
- Renaming Columns
- Splitting and Combining Columns
- Filtering Data
- Merging Queries
- Appending Data
- Creating Relationships
- Data Modelling
- Understanding Tables
Module 3: DAX, Calculations and Data Visualization
The third module focuses on calculations and visual reports. Students learn the basics of DAX, which is the formula language used in Power BI. They can use DAX to create useful calculations and measures for reports.
Students also learn how to select the right charts and visuals for different types of information. They can create charts for sales, customers, products, expenses, performance, and other business data.
Topics Covered
- Introduction to DAX
- DAX Basics
- Measures
- Calculated Columns
- SUM and COUNT
- CALCULATE
- Basic Time Intelligence
- Creating Charts
- Bar and Column Charts
- Line Charts
- Pie and Donut Charts
- Cards and KPI Visuals
- Tables and Matrix
- Filters
- Slicers
Module 4: Interactive Dashboards and Real-World Projects
The final module brings all the skills together. Students learn how to create attractive and easy-to-use dashboards. They can add filters, slicers, charts, cards, and other visuals so users can explore the information.
Students also work on practical projects. These projects can include sales dashboards, customer reports, employee performance reports, financial reports, and business performance dashboards. Project work helps students understand how Power BI can be used to solve real workplace problems.
Topics Covered
- Dashboard Planning
- Dashboard Design
- Interactive Reports
- Slicers and Filters
- KPI Dashboards
- Drill-Down
- Drill-Through
- Bookmarks
- Report Navigation
- Publishing Reports
- Sharing Reports
- Sales Dashboard Project
- Customer Analysis Project
- Business Performance Dashboard
- Final Power BI Project
Why Choose IICE Computer Education Shimla?
Choosing the right institute is important when learning a technical skill. Students should look for a clear syllabus, practical classes, trainer guidance, projects, and enough time to practise.
IICE Computer Education Shimla provides computer and technology education for students and learners. For people searching for a Power BI Course in Shimla, learning locally can provide face-to-face interaction, regular practice, and direct support during classes.
Before joining, students should check the latest course duration, fees, batch timings, syllabus, certificate information, and practical training details with the institute.
FAQs
What is a Power BI Course and what will students learn?
A Power BI Course teaches students how to connect, clean, analyze, and present data through interactive reports. Students can learn Power Query, data modelling, DAX, charts, filters, dashboards, KPIs, and practical projects.
Who can join a Power BI Course in Shimla without experience?
Students, graduates, job seekers, working professionals, and beginners can join a Power BI Course in Shimla. Basic computer knowledge is helpful, but previous Power BI experience or advanced programming knowledge is not required.
Is Power BI difficult for beginners to learn?
Power BI can be easy for beginners when each topic is taught step by step with simple examples. Regular computer practice can help students understand data cleaning, charts, calculations, reports, and interactive dashboards more comfortably.
What topics are covered in Power BI training in Shimla?
Power BI training in Shimla can cover data importing, Power Query, data cleaning, relationships, data modelling, DAX, charts, filters, slicers, KPIs, and dashboards. Students can also practise these topics through real-world reporting and visualization projects.
Do I need coding knowledge before learning Power BI?
No, students do not need advanced coding knowledge before starting Power BI training. DAX formulas are introduced gradually, and students can learn calculations and other technical concepts through simple examples and practical dashboard exercises.
Can I learn Power BI after completing Advanced Excel training?
Yes, Advanced Excel can provide a useful foundation for learning Power BI and understanding business data. Knowledge of formulas, tables, Pivot Tables, data cleaning, charts, and reports can make the transition to Power BI easier.
What career opportunities are available after learning Power BI?
Power BI skills can help students explore different data, reporting, and business-related career opportunities. Depending on their qualifications and experience, they can apply for roles such as Data Analyst, MIS Executive, Reporting Analyst, BI Analyst, or Junior Business Analyst.
Is Power BI training suitable for students and beginners in Shimla?
Yes, Power BI training can be suitable for students and beginners who want to develop practical data and reporting skills. A beginner-friendly program can start with basic concepts before moving toward data modelling, DAX, dashboards, and advanced reporting.
What practical projects can students create after learning Power BI?
Students can create projects such as sales dashboards, customer analysis reports, expense dashboards, employee performance reports, and business performance dashboards. These projects help learners practise data cleaning, calculations, visualization, filters, KPIs, and interactive reporting.
Is Power BI useful for building a career in data analytics?
Yes, Power BI is a useful tool for creating business reports, dashboards, and visual insights from data. Learning it along with Excel, SQL, Python, statistics, and communication skills can help students build a stronger foundation for data analytics careers.