
Business Analytics with AI Course
August 18, 2026 2026-08-18 6:05Business Analytics with AI Course
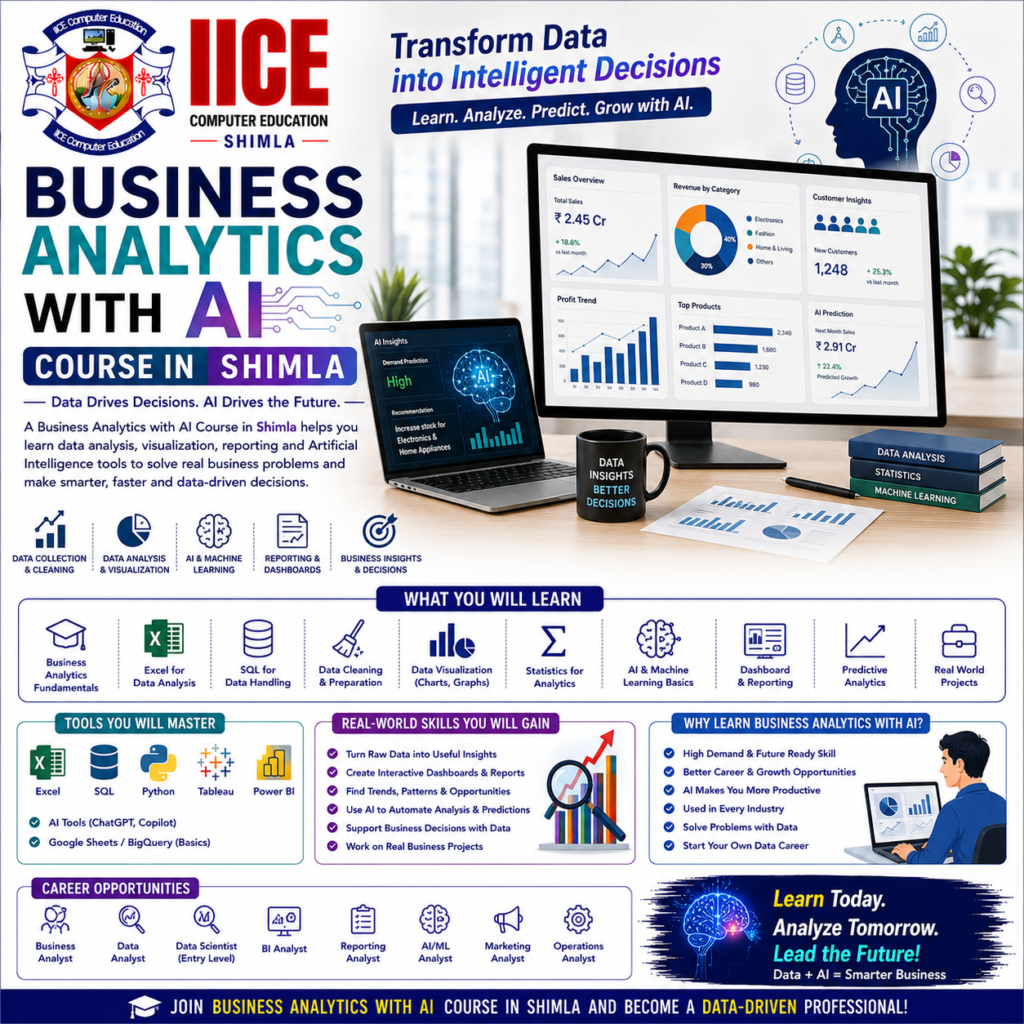
Business Analytics with AI Course in Shimla
Introduction
A Business Analytics with AI Course in Shimla helps students learn how businesses use data to understand problems, find useful information, and make better decisions. Students can learn how to work with data, create reports, understand charts, find patterns, and use Artificial Intelligence to make analysis faster and more useful.
At IICE Computer Education Shimla, students can learn these concepts step by step through simple lessons, computer practice, data exercises, AI tools, and practical business projects.
Business analytics may sound difficult at first, but students can learn it by starting with simple examples. For example, a shop can study which products sell the most, a company can check its monthly expenses, or a business can use customer data to understand what people like. AI can then help analyze large amounts of information, create summaries, find patterns, and support business decisions.
What Is Business Analytics with AI?
Business Analytics means using data to understand what is happening in a business and make better decisions.
AI adds another layer by helping people work with data more quickly and discover useful information.
For example, imagine a shop has sales data for one year. Business analytics can help answer questions such as:
- Which product sells the most?
- Which month has the highest sales?
- Which products are not selling well?
- Which customers buy most often?
- How are sales changing over time?
AI tools can help summarize this information, identify patterns, and assist with creating reports.
In simple words:
Data → Analysis → Insights → AI Support → Better Decisions
Why Learn Business Analytics with AI?
Almost every business creates data through sales, customers, websites, social media, payments, employees, and other activities. Understanding this information can help businesses make more informed decisions.
Learning Business Analytics with AI can help students develop both data and technology skills.
Key Benefits
- Learn business analytics from basics
- Understand business data
- Learn Excel for data analysis
- Work with SQL and databases
- Create charts and reports
- Learn Power BI
- Understand dashboards
- Learn basic statistics
- Use AI tools for analysis
- Find patterns in data
- Create business reports
- Work on practical projects
- Develop data-driven thinking
Business Analytics with AI Course for Beginners
A Business Analytics with AI Course in Shimla can be suitable for school and college students, graduates, job seekers, business owners, working professionals, data learners, and beginners interested in learning how data can support business decisions.
Students do not need advanced mathematics or programming knowledge to start. Basic computer knowledge and an interest in working with numbers and information can be enough to begin.
What Will You Learn?
Students can learn the complete basic process of turning business data into useful information.
The learning journey can include:
Business Basics → Data Collection → Excel → SQL → Statistics → Power BI → AI Tools → Business Insights → Projects
The course can gradually introduce students to different tools instead of asking them to learn everything at once.
Business Analytics with AI Course Syllabus
Module 1: Business Analytics & Excel
- Introduction to Business Analytics
- Understanding Business Data
- Types of Business Data
- Data Collection Basics
- Data Cleaning
- Business Metrics and KPIs
- Excel for Data Analysis
- Excel Formulas and Functions
- Sorting and Filtering
- IF, SUMIF and COUNTIF
- Lookup Functions
- Pivot Tables
- Pivot Charts
- Data Visualization Basics
- Excel Dashboard
- Sales Data Analysis Project
Module 2: SQL & Data Analysis
- Introduction to Databases
- Understanding Tables and Records
- Introduction to SQL
- SELECT Queries
- WHERE Conditions
- ORDER BY
- GROUP BY
- Aggregate Functions
- SQL Joins
- Filtering Business Data
- Customer Data Analysis
- Sales Data Analysis
- Business Reports Using SQL
- Practical SQL Project
Module 3: Power BI & Business Dashboards
- Introduction to Power BI
- Power BI Interface
- Importing Data
- Data Cleaning
- Data Relationships
- Basic Data Modelling
- Charts and Visualizations
- Bar and Line Charts
- Cards and Tables
- Filters and Slicers
- Interactive Dashboards
- Business KPIs
- Dashboard Design
- Sales Dashboard
- Customer Dashboard
- Business Performance Dashboard Project
Module 4: AI for Business Analytics & Projects
- Introduction to AI in Business Analytics
- Generative AI Basics
- AI-Assisted Data Analysis
- Using AI for Data Summaries
- Finding Patterns with AI
- AI for Customer Analysis
- AI for Sales Analysis
- AI for Marketing Analysis
- AI-Assisted Business Reports
- Prompting for Data Analysis
- AI-Based Business Insights
- Responsible Use of AI
- Real-World Business Analytics Project
- Final Dashboard Project
- Project Presentation
- Portfolio Development
Why Choose IICE Computer Education Shimla?
Business analytics becomes easier when students work with real-looking business data instead of studying only definitions. Practical exercises can help students understand how a simple spreadsheet can become a report, dashboard, or business insight.
IICE Computer Education Shimla provides computer and technology training with a practical learning approach. Students choosing a Business Analytics with AI Course in Shimla can learn through structured lessons, data exercises, Excel practice, SQL, Power BI, AI tools, trainer guidance, and practical projects.
Key Reasons to Choose IICE
- ISO 9001:2015 Certified
- Government Registered
- MSME/Udyam Registered
- Practical computer training
- Beginner-friendly learning
- Excel for business analytics
- SQL and database basics
- Power BI training
- Data visualization
- Business dashboard projects
- AI tools for analytics
- Business-focused projects
- Trainer guidance
- Portfolio development
- Career-focused learning
- Classroom training in Shimla
IICE can be considered by students who want to learn how data and AI can be used together to understand business problems and create useful reports and insights.