
Advanced Excel for Data Analytics
August 10, 2026 2026-08-12 8:38Advanced Excel for Data Analytics
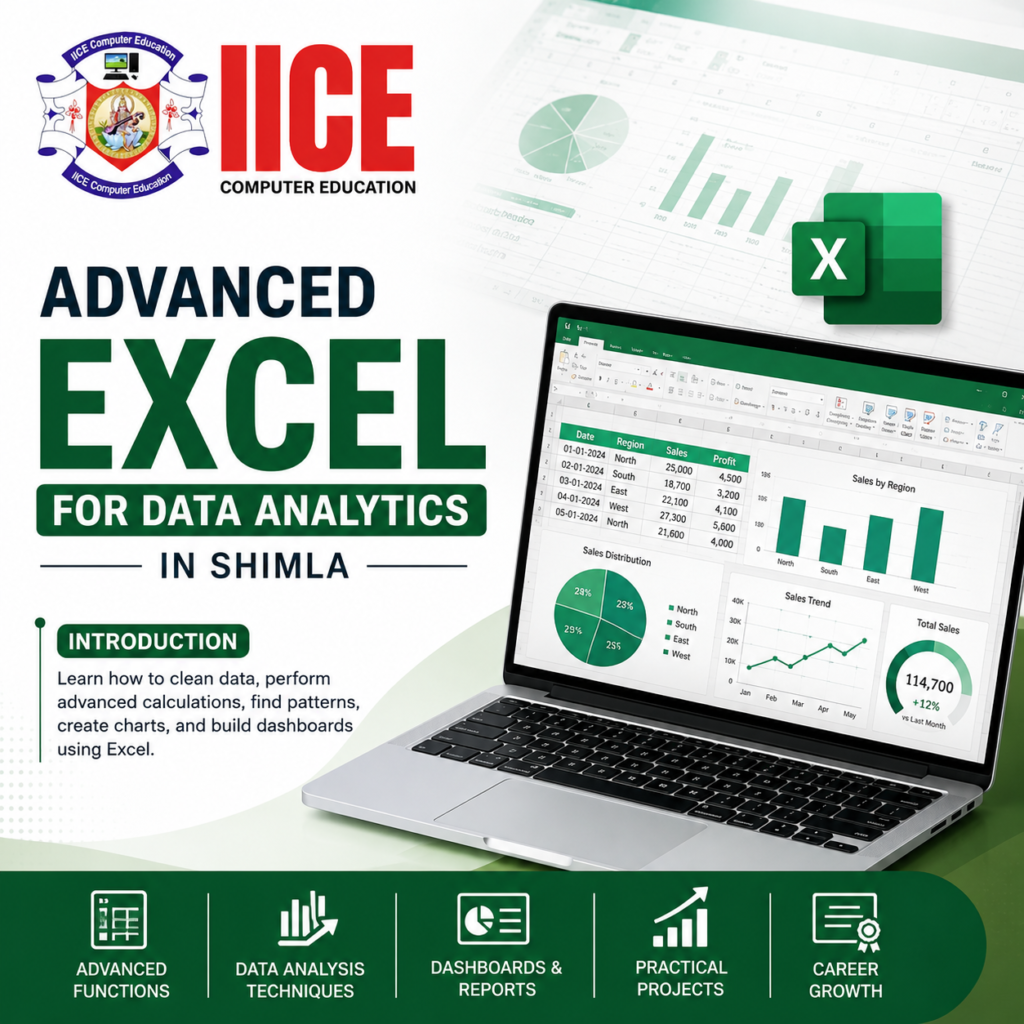
Advanced Excel for Data Analytics in Shimla
Introduction
Advanced Excel for Data Analytics is a practical course for students who want to learn how Excel can be used to understand and work with data. Excel is more than a simple tool for writing numbers in rows and columns. It can help you clean information, calculate results, find patterns, create charts, and make simple dashboards. At IICE Computer Education Shimla, this learning path can help beginners understand Excel step by step through simple explanations and practical computer work. If you are searching for Advanced Excel for Data Analytics in Shimla, this course can be a useful starting point for building strong spreadsheet and data skills.
What Is Advanced Excel for Data Analytics?
Advanced Excel for Data Analytics means using Excel’s more powerful features to study and understand information. For example, a shop may have thousands of sales records, and Excel can help find the best-selling product, compare monthly sales, check customer information, and create a report. Students learn how to take a large table of information and turn it into clear and useful answers. This makes Excel an important skill for students, office workers, business owners, and people who want to work with data.
Why Learn Advanced Excel for Data Analytics?
Learning Advanced Excel for Data Analytics can help you become more comfortable with numbers, tables, reports, and business information. Excel is easy to start with, but it also has powerful features that can be used for more complex work. Students can learn formulas, lookup functions, Pivot Tables, charts, data cleaning, dashboards, and other useful features. These skills can help learners prepare for office work, reporting jobs, MIS roles, business analysis, and entry-level data-related positions.
Advanced Excel Course in Shimla
If you are looking for an Advanced Excel Course in Shimla, practical learning should be an important part of your choice. At IICE Computer Education Shimla, students can learn Excel through examples and exercises that are easy to follow. Instead of only learning what a formula means, students can practise using it on actual tables and sample business information. This approach helps learners understand how Excel can be used in everyday office and data work.
Advanced Excel Training in Shimla
Advanced Excel Training in Shimla can be useful for students, graduates, working professionals, and beginners who want to improve their computer skills. The training can begin with basic spreadsheet work and slowly move toward advanced formulas, Pivot Tables, data cleaning, charts, and dashboards. Students can practise each topic on a computer, which helps them remember the steps and become more confident while working with Excel.
Advanced Excel for Data Analytics – Syllabus
Module 1: Excel Fundamentals & Data Management
- Introduction to Excel for Data Analysis
- Excel Workbook and Worksheet
- Rows, Columns, Cells and Ranges
- Data Entry and Formatting
- Excel Tables
- Sorting and Filtering Data
- Data Validation
- Find and Remove Duplicates
- Named Ranges
- Basic Excel Formulas
- Cell References
- Error Checking and Correction
Module 2: Advanced Excel Formulas & Functions
- IF and Nested IF Functions
- SUMIF and SUMIFS
- COUNTIF and COUNTIFS
- AVERAGEIF and AVERAGEIFS
- VLOOKUP
- XLOOKUP
- INDEX and MATCH
- TEXT Functions
- DATE and TIME Functions
- Logical Functions
- Mathematical Functions
- Combining Multiple Functions
- Formula Error Handling
Module 3: Data Analysis & Visualization
- Data Cleaning in Excel
- Conditional Formatting
- Pivot Tables
- Pivot Charts
- Grouping Data
- Advanced Sorting and Filtering
- Charts and Graphs
- Column and Bar Charts
- Line Charts
- Pie Charts
- Combination Charts
- Basic Data Visualization
- Data Analysis Reports
Module 4: Dashboards, Power Query & Projects
- Introduction to Excel Dashboards
- Dashboard Layout and Design
- KPI Cards
- Interactive Charts
- Slicers and Timelines
- Power Query Basics
- Importing Data
- Data Transformation
- Combining Data
- Automated Reports
- Sales Analysis Project
- Customer Analysis Project
- Expense Analysis Project
- Business Dashboard Project
- Final Excel Data Analysis Project
Career Opportunities After Advanced Excel Training
After learning Advanced Excel for Data Analytics, students can use their skills for roles such as MIS Executive, Reporting Executive, Data Entry and Reporting Executive, Junior Data Analyst, Operations Executive, and other office-based positions where Excel is used. Career opportunities depend on your education, experience, communication skills, practical knowledge, and other technical skills. Learning SQL, Power BI, or Python later can also help you build a broader data career.
Why Choose IICE Computer Education Shimla?
IICE Computer Education Shimla focuses on computer and technology education and offers practical learning opportunities for students. For learners searching for Advanced Excel for Data Analytics in Shimla, a local classroom environment can provide direct interaction with trainers and regular computer practice. Students can learn through examples, exercises, assignments, and projects instead of only reading theory. Before joining, students should check the latest course duration, fees, batch timings, syllabus, certificate details, and available facilities directly with the institute.
FAQs
What is Advanced Excel for Data Analytics and who can learn it?
Advanced Excel for Data Analytics teaches students how to organize, clean, analyze, and present information using Excel. Students, graduates, job seekers, working professionals, and beginners can learn these skills with basic computer knowledge.
Who can join Advanced Excel training in Shimla without experience?
Students and beginners can join Advanced Excel training in Shimla even without previous advanced Excel experience. The topics can be taught from the basics, allowing learners to understand formulas, reports, Pivot Tables, charts, and dashboards step by step.
What skills will I learn in Advanced Excel training?
Students can learn formulas, lookup functions, data cleaning, sorting, filtering, Pivot Tables, charts, dashboards, Power Query, and data reporting. Practical exercises can help learners understand how these features are used with real business and workplace data.
Is Advanced Excel difficult for beginners to learn and understand?
Advanced Excel can look difficult when you first see many formulas and tools, but it becomes easier with regular practice. Simple explanations, practical examples, exercises, and projects can help beginners understand each topic gradually.
What is the difference between Basic Excel and Advanced Excel?
Basic Excel mainly covers data entry, formatting, simple calculations, and commonly used formulas for everyday tasks. Advanced Excel includes powerful functions, Pivot Tables, Power Query, dashboards, data cleaning, advanced reporting, and detailed data analysis.
Can I use Advanced Excel skills for data analysis and reporting?
Yes, Excel can be used to organize large datasets, perform calculations, identify patterns, and prepare useful reports. Pivot Tables, formulas, charts, dashboards, filters, and Power Query can make data analysis and reporting faster and easier.
Which Excel formulas and functions are taught during the training?
Students can learn functions such as IF, SUMIF, SUMIFS, COUNTIF, COUNTIFS, XLOOKUP, VLOOKUP, INDEX, MATCH, TEXT, and DATE functions. They can also learn how to combine functions and handle common formula errors.
What career opportunities are available after learning Advanced Excel?
Advanced Excel skills can be useful for office, reporting, operations, and entry-level data-related roles. Depending on your education and experience, you can explore positions such as MIS Executive, Reporting Executive, Operations Executive, and Junior Data Analyst.
Is Advanced Excel training available for students in Shimla?
Students searching for Advanced Excel training in Shimla can explore computer education institutes that provide practical Excel learning. Before joining, check the current syllabus, course duration, fees, batch timings, practical classes, trainer support, and certificate details.
Can Advanced Excel skills help me learn Power BI later?
Yes, Advanced Excel provides a strong foundation for learning Power BI and other data tools. Knowledge of tables, data cleaning, formulas, reporting, Pivot Tables, and visualization can make it easier to understand Power BI concepts.